Debugging Features the Easy Way
I once heard an analogy that navigating a submarine was like painting
over all the windows in your car, cracking the window and a attempting
to drive somewhere using only sound. Since I don’t have a sub handy I can’t speak to the accuracy of that, but sometimes debugging in SharePoint seems only slightly easier.
If you’ve ever created a FeatureReceiver, then you’ve probably also
had it not work. There’s some code that’ll work right the first time
for you, that never seems to be a custom feature. When the feature
doesn’t work you either don’t get the result you were expecting, or
worse, Something Bad Happened. Even if you assume that you’ve already got
your development environment set up so you can debug a web part, its
not immediately obvious how to debug that feature that’s causing your
problems.
Well, you’ve come to the right place! Here’s a couple options to fix
up your broken feature:
Attach to w3wp (aka Its Still SharePoint)
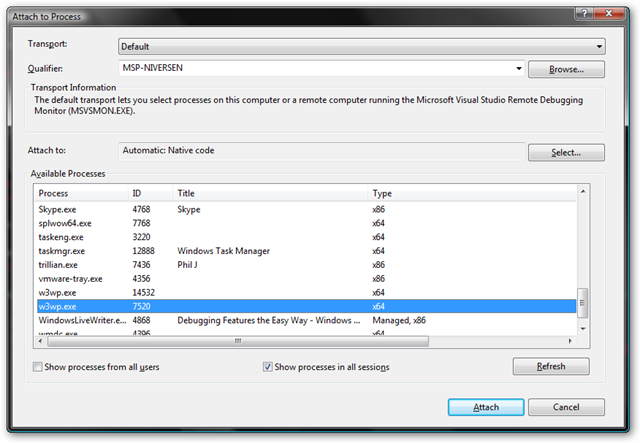
If you’ve ever (successfully) debugged in SharePoint you are probably familiar with this approach. Fire up visual studio and attach to the w3wp.exe process and then Activate the feature. Setting a breakpoint in your FeatureActivated and activating the feature through the web UI works in the debugger like you’d expect, so why not just stick with this approach? The biggest reason is you can’t do the same thing for FeatureInstalled or FeatureUninstalling. Since you have to use STSADM for those actions, attaching to w3wp isn’t going to do anything for you.
Console/Debug.WriteLine (aka printf forever!) 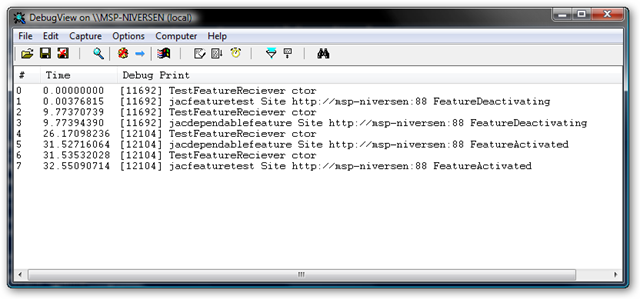
Bring on that retro flavor! Liberally sprinkle Console.WriteLine’s in your code and you’ll feel like you’ve been teleported back in time and you are writing a C based console app, or at least like a Response.Write from classic ASP. Using the WriteLines you can ‘debug’ your code without the use of a debugger and you now have access to Installed and Uninstalling. If you are using stsadm, Console.WriteLine will work fine. If you are activating via the web, or just don’t like other people to see your debugging messages you can use Debug.WriteLine and view the output with something like DebugView. The downside is you have to use STSADM to do your Installation and Deactivation and don’t really have the option of using a debugger if you wanted to. You’ll have to be pretty quick to attach to the STSADM process before it finishes (or be on a really slow server).
Force the Debugger (aka The Easy Way)
The previous two options have each been useful but have had some pretty serious caveats to using them for everything, if only there was another way!. Luckily there is, we can just force the debugger to run. By putting the line System.Diagnostics.Debugger.Launch(); in our code, it’ll attempt to start the debugger. This approach will work regardless of if you are using STSADM or the UI. You’ll be presented with the "Launch Visual Studio" dialog. If you’ve already got the project open, select your running instance of Visual Studio. Otherwise open a new instance and browse to find your code.
These options should get you on the right track, and who knows, you might even
start like writing FeatureReceivers…or not.
2 Comments so far
Leave a reply
I’ve used NUnit tests + TestDriven.NET to test my feature receivers.
Debugging is nice though.
Peter: Thats a good point, a TDD example would probably be a good one to add.